In this blog post I will explore the difference between the ‘SELECT … INTO’ and ‘INSERT … SELECT’ statements. I recently moved some data for a customer to a brand-new table due to the bad design of the source table. First, I created the destination table and then I ran the ‘INSERT … SELECT’ statement. I ran this in a test environment first, where the query took longer than 1 hour to complete and the database’s transaction log file grew by 50GB, even though the table was only 18GB. A colleague suggested I use the ‘SELECT … INTO’ statement instead and that got me thinking: why is this faster or any better?
The most obvious thought is that the first one runs faster because it benefits from ‘minimal logging’ and creates the target table automatically. Of course, ‘SELECT … INTO’ does produce the destination table on the fly based on the result of the SELECT statement, however, I was curious about why it was faster.
Scenario
For testing purposes, I used the ‘FactProductInventory’ clustered table in the AdventureWorksDW2012 database. The table has 776,286 rows for a total size of 41MB. The database was in the FULL recovery model and its transaction log file was 109MB with 98.3% of free space.
I enabled ‘STATISTICS TIME’ and ‘STATISTICS IO’ to view query (execution time and CPU) and disk I/O (read and writes) statistics. I also tracked the log space usage by looking at the ‘DBCC SQLPERF(LOGSPACE)’ view. For those who are interested fn_dblog() provides more details, which I personally found more useful because you read thought the transaction log and see row by row what is happening.
SELECT … INTO
The first test I ran was the ‘SELECT … INTO’ statement that selected all the rows (776,286) from ‘FactProductInventory’ into the target table ‘FactProductInventoryNew’.

Here are the statistics:

As we can see in the above results, SQL Server brings the source table’s pages into the buffer cache (read-ahead reads) and then performs 5231 logical reads, which is exactly what you’d expect to see. The table has 5231 pages (1 IAM, 18 index pages and 5212 data pages) and, considering that everything was selected, SQL server had to scan through the whole table. The duration was roughly 1.3 seconds with a CPU usage of 1 second.
![]()
The transaction log didn’t grow but we can see from the above screenshot that an extra 37.5% (40.8MB) of its space has been used, which is roughly the size of the table. Therefore, all the selected rows have been fully logged in the transaction log file. Be aware that this is not a minimally logged operation because the database is in the FULL recovery model.
To take advantage of minimal logging the database would need to be in the BULK_LOGGED or SIMPLE recovery models, at which point SQL Server keeps track of extent allocations and metadata changes only.
INSERT … SELECT
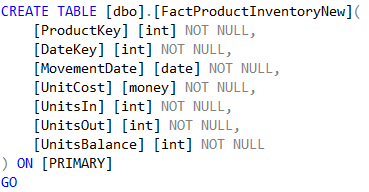
Before starting my next test, to ensure that I had a clean starting point, I restored the database from backup. I then ran the ‘INSERT … SELECT’ statement, before which I had to create the new table with the same structure as the source one.

Here are the results:

As you can see, the query took 5.8 seconds to complete (almost 5 times slower than the previous one) and used approximately 108MB of transaction log space (nearly three times as much).
![]()
The logical reads against the source table were the same, however, I noticed something strange. As you can see in the highlighted statistics above, SQL Server performed 781,495 reads against the destination table! We only inserted data, so why would SQL Server read from the target table?
Because the target table already exists, SQL Server has to read a page on the target table for every single row to establish where the row is going to be inserted to. As you can see above, an extra 5209 reads were performed compared to the number of rows in the table (776,286). This is the number of times that SQL Server has to read the PFS page. The PFS (Page Free Space) tracks free space for LOB values and heap data pages and 1 PFS page exists for 8088 database pages or about 64MB.
Furthermore, SQL Server needs to place a lock on that page to prevent other transactions from modifying or inserting rows on the same page. Note that these operations (locks, data page changes, PFS reads and so on) must be tracked in the transaction log file along with the inserted rows, which is why it uses more space in the transaction log file. For those interested, the following query can be executed to retrieve the above information (assuming that your insert statement is the only one running against your database):

INSERT … SELECT WITH(TABLOCK)
At this point I was curious about what would happen if I had an exclusive lock on the table. So, after restoring the database, I ran the following statement:

Here are the stats:

Because SQL Server has now exclusive access to the entire table, it no longer needs to worry about concurrency and locking, and it can just go ahead and dump data into the table. Looking at the stats, we can see that the ‘INSERT SELECT’ performed exactly the same as the ‘SELECT INTO’ statement, transaction log space usage included.
![]()
Conclusions
There are no minimally logged operations in the FULL recovery model. As the ‘SELECT … INTO’ creates the destination table, it exclusively owns that table and is quicker compared to the ‘INSERT … SELECT’. Because the ‘INSERT … SELECT’ inserts data into an existing table, it is slower and requires more resources due to the higher number of logical reads and greater transaction log usage. However, providing the query hint to lock the entire destination table, the two statements perform exactly the same.