
“How does Microsoft Fabric compare to Azure Synapse and Azure Data Factory?” This question has been on the minds of Microsoft data stack users since Fabric’s announcement, usually focusing on the lakehouse and data engineering capabilities. However, as Coeo’s Managed Services team supports more Fabric solutions as businesses migrate to the service, I found myself particularly interested in how the monitoring capabilities might differ. After all, the Monitor tab is where I spend most of my time in our clients’ Data Factory and Synapse workspaces.
Monitoring in Fabric takes place in the Monitoring Hub. This hub displays a list of all activities run across all workspaces the user has permissions for (so potentially quite a lot of objects!). Pipeline runs are listed alongside semantic model refreshes, notebook runs and Gen2 Dataflows. Users can filter by item type and run status. My first impression is, it’s a cleaner, simplified version of the Data Factory Monitor tab.
I was particularly keen to see how Fabric handles monitoring parent and child pipelines (that is, pipelines that call other pipelines), as this pattern is common in production environments and can be hard to visualise. Let’s go through a really simple monitoring/troubleshooting scenario and compare Fabric’s approach against what we’re used to in Synapse and Data Factory.
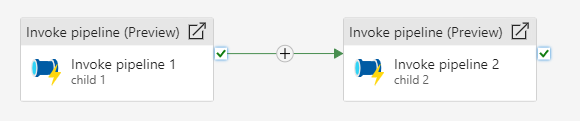
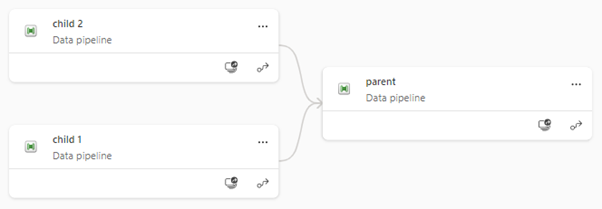
Say I have a pipeline, imaginatively named “parent”, that consists of the following activities:
The pipeline “child 1” consists of the following Wait activity:
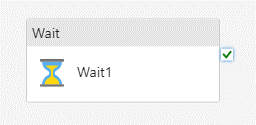
It will wait 1 second, and we can be pretty confident it will succeed every time it runs. The “child 2” pipeline contains only a Fail activity:
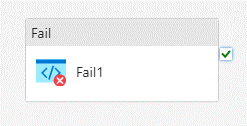
Again, this should fail on every run. When I kick off the parent pipeline with this configuration, events will unfold as follows:
- Parent pipeline will start by invoking the child 1 pipeline
- Child 1 will succeed
- Parent pipeline will move on to the next activity, child 2
- Child 2 will fail
- Parent pipeline will report failure due to a failed child pipeline
In Synapse and ADF, the above flow will appear in the Monitor > Pipeline Runs tab like this:
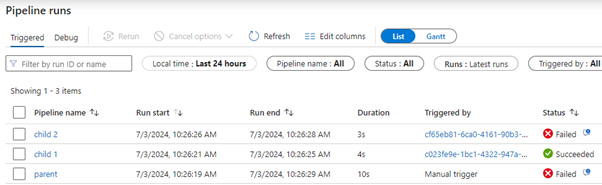
If you’re familiar with Azure Synapse and Data Factory, you’ll probably recognise this layout. It works, but it’s not perfect, as there’s no explicit indication of the relationship between pipelines.
In my example, these pipelines are the only ones running, and we can infer from the run start/end times (and the pipeline names) that they’re related. But if you have a production environment with many processes running at once and worker child pipelines being invoked by different parents with different parameters, then this kind of view can be chaotic, and the lineage can be unclear until you click into a parent to see the order of activities for that run.
Let’s see how the Fabric Monitoring Hub presents this info.
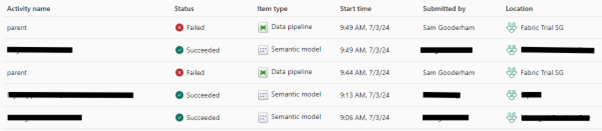
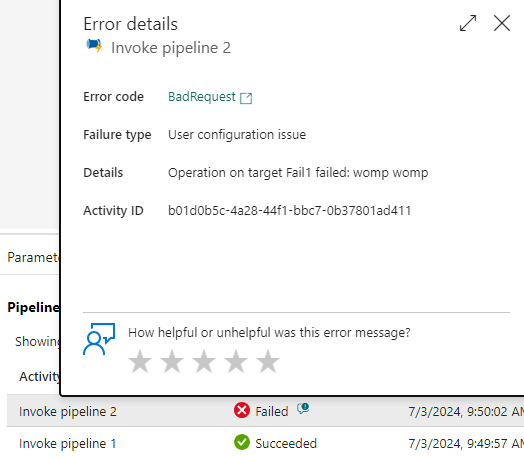
Well, that gets around the lineage issue I suppose! No child pipelines show at all, meaning the only way to see them is to click into the parent run where you can see the order of activities (identical to Synapse/ADF):
I thought initially that it might have been a design choice by Microsoft to not show child pipelines (and perhaps it was to begin with) but this blog confirms they’re currently working on a fix to include child pipelines in the Fabric Monitoring Hub.
When this fix arrives, I hope there’ll be an indication of pipeline lineage, though implementing this could be a challenge as – they’ve chosen to make the Monitoring Hub a catchall for every type of object you can create in Fabric. This limits their ability to present information that is specific to a given item type. For instance, a Parent column wouldn’t make sense for a semantic model, or a lakehouse, so there probably won’t be one. There are ‘Upstream Run’ and ‘Downstream Runs’ columns available, which sound promising for this purpose. However, I suspect the intention with them is to show the lineage between different objects in a Fabric workspace, rather than nested pipelines. Interestingly, these columns are blank for my parent pipeline runs, despite the lineage being visible in the Workspace lineage view. This seems slightly counterintuitive – shouldn’t children be upstream from parents?
There’s one other small feature I’m sad to see missing from the Monitoring Hub. In Data Factory, there was a handy little speech bubble icon next to a failed activity, which allowed quick access to error information without having to dig through activities. In Fabric, this icon is gone. Instead, there’s a details pane that can be opened, which shows the following:
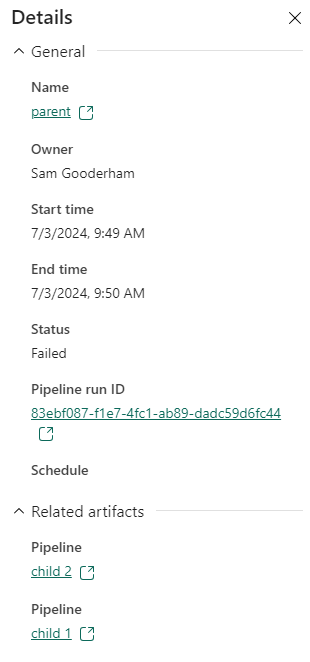
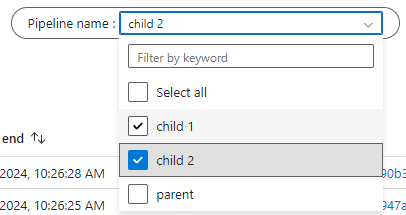
Here we get the child pipelines, but no indication of which one failed, and no error messages. As far as I can tell, the only way to view your error is to dig into the pipeline run and find the failed activity. Hopefully, this will be addressed in future as Fabric continues to improve. Let’s consider a final scenario: Imagine you’re managing a busy ETL environment with lots of separate processes running, and two unrelated pipelines fail around the same time. I might want to investigate them both together, in case the failure cause is the same (data source/API issues, integration runtime blip, etc). In ADF and Synapse, this investigation is straightforward. You can filter for specific pipelines using a dropdown that combines tick boxes with a search bar; the search bar filters the dropdown by what you type, but checked boxes persist even when they don’t appear, so you can search for pipelines with completely different names and have them all appear together:
The Fabric Monitoring Hub does not have this functionality yet – instead, there is only a search bar which filters results as you type. This creates a challenge: if you want to view two items together, with everything else filtered out, you currently can’t do so unless they have similar names. As an example, if I type “model” into the search bar I am shown all our Power BI semantic models that have “model” somewhere in the name:
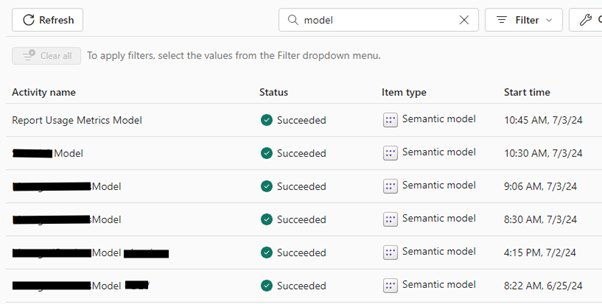
This approach works fine for related items but is less useful for our scenario where we need to more finely customise the objects that get filtered out.
An important final point to make is that the Fabric monitoring experience detailed here is just its current state, and it’s still early days. I look forward to seeing how Microsoft develop and refine the Monitoring Hub as time goes on and user feedback starts coming in.
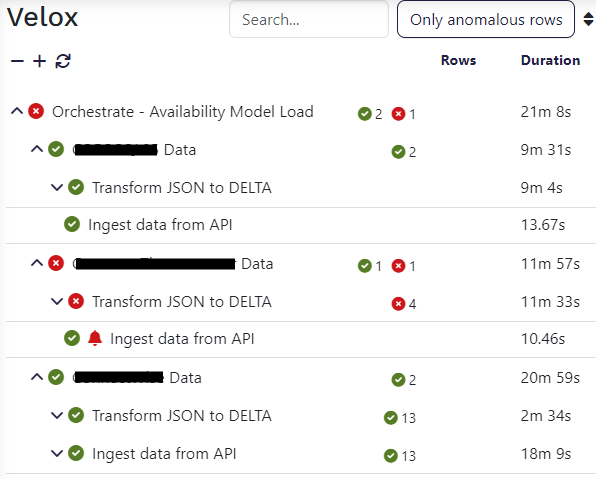
I’ll admit, I’ve probably been spoiled a bit by the monitoring capabilities of Coeo’s Velox solution, which shows Azure pipeline lineage visually, pulls error messages and other metadata, and comes with anomaly detection (the bell in the image below) for highlighting activities that behave differently to usual:
As it stands, I would say Synapse and Data Factory offer a smoother monitoring experience compared to Fabric, but I see no reason why the Monitoring Hub couldn’t improve considerably on previous offerings given time. Only time will tell!
If you want to know more about our Velox solution or how our managed service team can support you, contact us at info.coeo.com.